Strategic mine planning is all about defining a strategy to exploit the defined mineral resource in a way that maximises value throughout the life of mine. The strategic plan should always be aligned with the view of the organisations’ future outlook. The strategic planning process is more focussed on defining a Life of Mine Plan (LOMP) that best delivers the corporate goals in the long term. At this stage of planning, one is usually trying to answer that the following three critical questions:
- Considering both the economic parameters and engineering constraints, what portion of the orebody is feasible to mine over the life of mine;
- When and in what order to extract that particular portion of the orebody; and
- Where to send the extracted material (dump, plant, stockpile etc.) in order to maximise the corporate goals
The process of answering these 3 important questions, formally known as Strategic Planning, enables organisations to determine limitations, constraints and maximise the value of their resources. The key outcome of strategic planning is the Life of Mine Plan (LOMP), which is normally reviewed and updated annually due to a combination of changing market, economic and technical environments. A well-defined LOMP is essential since the LOMP provides a financial vision for a given project and establishes the framework within which all other plans (tactical and operational plans) are developed. If the long-term component is missing or not defined properly, experience has shown that operations will eventually start running into shorter-term, operational challenges. Short-term thinking often results in sterilisation of the Mineral Resource, lower production rates, and less efficient and profitable operations.
Conventionally, strategic planning is carried out following the 7 steps defined below:
- Defining Key Corporate Objectives, Constraints, Key Performance Indicators
- Open Pit Optimisation
- Detailed Pit Design
- Pushback Optimisation and Selection
- Strategic Scheduling
- Material Allocation
- Economic Evaluation and Analysis
In this article I will be using a dummy gold-copper deposit in order to go through the strategic planning process. It is important to keep in mind that this is a demo dataset and the parameters used are also based on assumptions.
1. Defining Key Corporate Objectives, constraints, Key Performance Indicators (KPIs)
Before any strategic planning work can commence, it is fundamental for organisations to define key objectives, constraints and KPIs which drives and supports the organisational future outlook. In most cases there are multiple and sometimes conflicting objectives. In my experience the most common overarching objective for most organisations is to increase the shareholder value through safe and responsible scheduling of resources to maximise NPV in the long-term context. NPV is the net present value of future cashflows discounted at a selected discount rate.
NPV has proven to be a good instrument for commercial valuation of projects since it involves valuation of both short-term value (which receives little discounting) and long-term value (which receives greater discounting). Organisations may have other or additional objectives and KPIs, including but not limited to, increasing life of mine, scales of operations, ability to adjust to external factors, exposure to risk, minimising cost of production, market specification, increasing metal recovery etc. These objectives and KPIs have to be fully defined, understood, and agreed upon in order to optimise the strategic planning.
As emphasised, I am using a massive copper-gold deposit and the main objective in this example is to maximise the project Net Present Value while minimising the exposure to risk. Other key KPIs and constraints for this project includes the tracking annual mass mined and milled as well as increasing the metal recovery.
Once the key objectives, constraints and KPIs are defined, the next step is to define the pit that yields the maximum (undiscounted) profit for the given resource model. This is done through a process known as Open Pit Optimisation.
2. Open Pit Optimisation
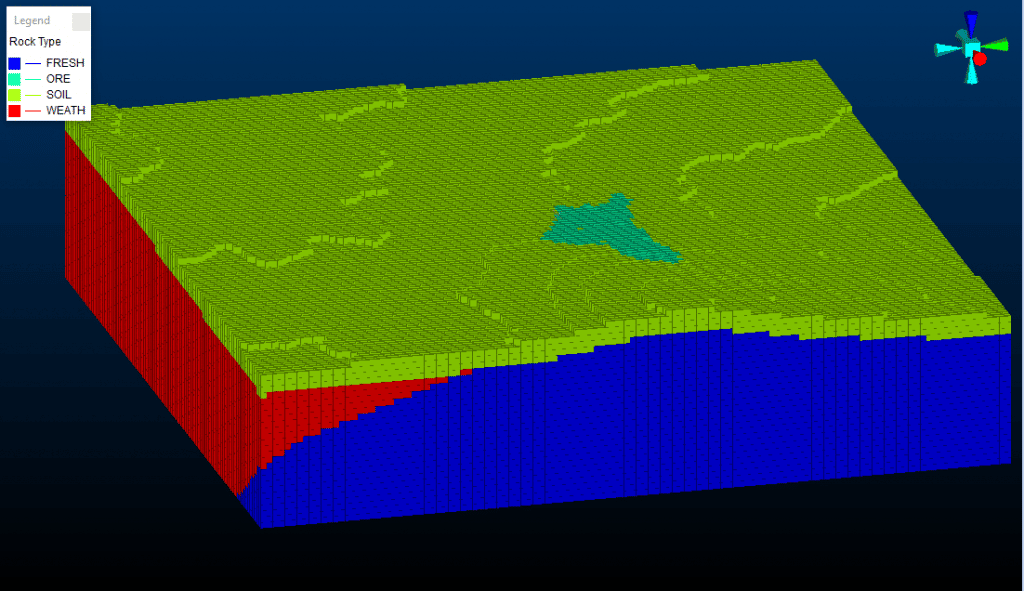
Pit optimization is the process of determining the optimal outline or shell to be mined to in order to maximise the profit while satisfying operational requirements. The starting point of the strategic planning process is a resource block model, in which ore and waste material are divided into regular 3D blocks as shown on Figure 1 below. Each regular block is assigned key attributes, such as grades, contaminants, rock type, recoveries, density etc.
Before any open pit optimisation work can commence, it is paramount to convert the resource model into a planning model. A planning model is one that mainly represents the reality and actual degrees of selectivity that can be achieved during practical mining operations. Some of the common processes involved when converting a resource model into a planning model include:
- Depleting the block model to remove cells are above the topography. For this you will need to define the starting topography for the optimisation. For greenfield projects this is straightforward, it is the original, undisturbed topography. For brownfield projects that are in operation, usually a forecasted topography is used;
- Regularise (REBLOCK) the block model to create block model cells matching the SMUs and re-calculating the block model attributes (e.g. grades, contaminants etc.) according to user-defined criteria. During this process, some ore will be diluted with waste material. In some instances, further dilution may be modelled using other dilution techniques such as DILUTMOD to model skin dilution;
- In some cases, you may want to define some additional attributes that are not defined in the resource model but are important for planning work. It is also a common exercise to remove some geological attributes that are not related to mine planning e.g. grade estimation parameters etc.;
- My preferred way of doing things is to model the geotechnical information on the planning model. Usually the geotechnical department will provide strings that delineate different geotechnical zones. I find it easier to transfer the information from the strings into the planning model;
- Constraining or expanding a block model. Before any optimisation work can commence on Datamine’s Studio NPVS, it is essential to ensure that you have sufficient waste blocks outside of the potential ore body for Studio NPVS to consider when generating the optimal pits. On the other hand, you do not want to have a very big model with unnecessary cells that do not add value to the optimisation (instead it affects the processing speed); and
- Where cost modelling is a big detailed and complex, you may also want to define Mining Cost Adjustment Factors (MCAF) and Processing Cost Factors (PCAF) on the model rather than doing that on the optimisation solution.
Once the planning model has been generated and imported into an optimisation solution such as Studio NPVS, then the economic model can be defined. The Economic Model is defined by setting cost and price parameters for the Life of Mine and then calculating an intrinsic value per processing method of each block in the planning block model as a function of its geo-metallurgical attributes. The value (although can be calculated externally and stored on the block model) is usually left to be calculated by Studio NPVS as part of the definition of the economic model. The following economic parameters defined on Table 1 were used in this gold-copper deposit example:
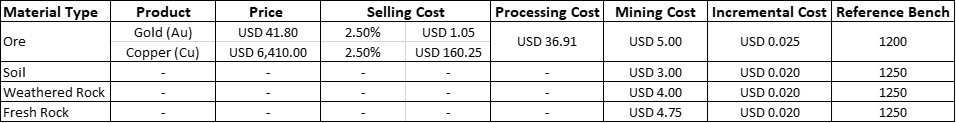
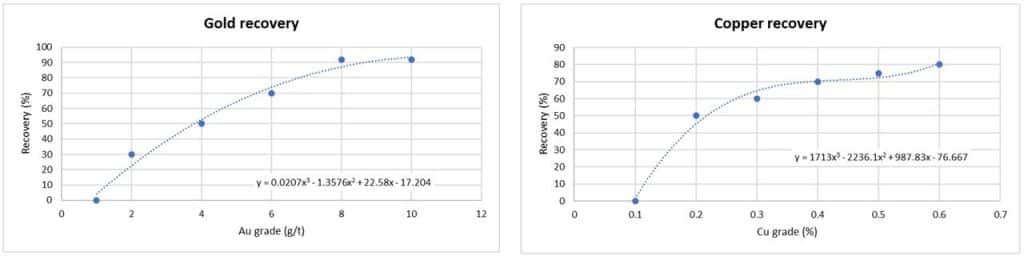
Additionally, the processing recoveries for gold and copper were defined through a Grade vs. Recovery graph as follows on Figure 2:
At specific economic, production and engineering parameters/assumptions, pit optimisation solutions such as Datamine’s Studio NPVS generates nested pit shells which indicates the project value at specific, progressive pit sizes. The nested pit shells are produced through a process known as pit limit parametrization through the use of revenue/profit factors. A revenue/profit factor is a variable which when multiplied with other pit optimisation parameters such as metal price, will produce the different nested pit outlines at different factoring.
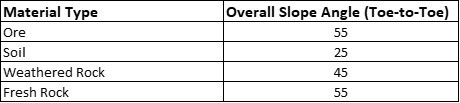
In this example the geotechnical parameters on Table 2 were used to run the ultimate pit analysis. In addition to the geotechnical parameters, a 14.5% discount rate and a minimum pit bottom width of 40m were defined.
Nested pit shells are always in the order of the highest to lowest value per tonnes mined. The sequence in which the growth of the nested pit shells progresses over time represents the optimal evolution of the mine over time. The nested pit shells generated for this gold-copper block model under the assumed economic and engineering parameters are summarised on Figure 3.
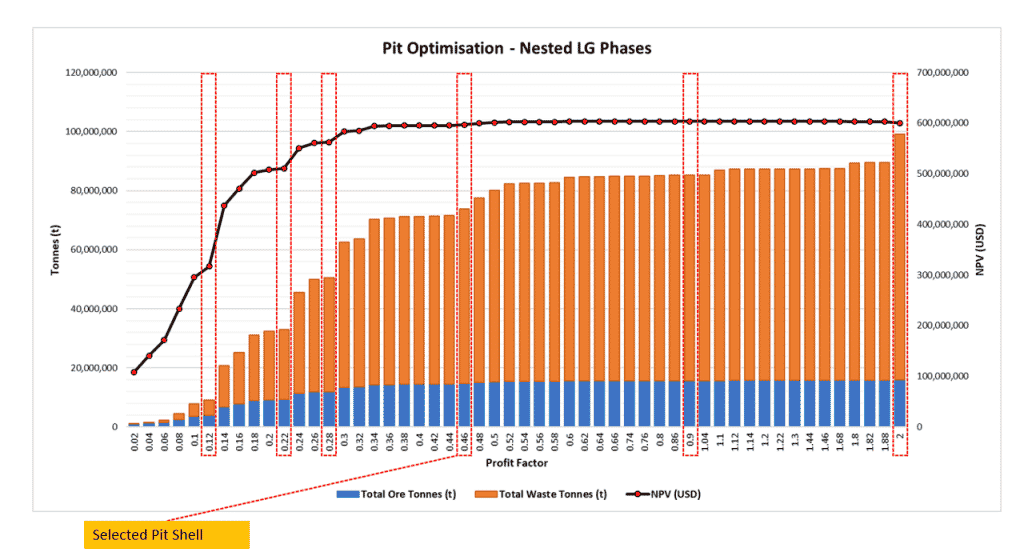
You can see clearly from Figure 3 that this particular deposit supports a range of pit sizes that all are technically mineable and economically profitable. Pit shell selection has to take into consideration the technical, financial, and social aspects. There are some remarkable pit shells that have been highlighted (with red-dotted vertical bars), from pit shell that maximises the reserve, the pit shell that minimises risk, the pit shell that produces the maximum NPV and some pit shells that combines the three aspects mentioned.
The smallest nested pit outline represents the most robust pit i.e., a pit that will be economically viable even under the worst economic conditions. The smallest nested pit guides the mine planning engineer to the portion of the deposit that should be extracted first since it remains financially attractive even after being penalised by a low revenue factor. The larger pits outline represents the pit with the longest life under the best economic conditions. The Lerch-Grossmann nested pit shells can be interpreted as a method of incorporating risk aversion into the mine planning problem They help mine planning engineers know where to begin mining and what sequence to mine the pit in order to produce the highest NPV from the material within the final pit.
In this example, the pit shell that was selected for further analysis is the pit shell at Profit Factor 0.46. This is obviously not pit shell with the maximum NPV. The difference in NPV between the pit shell at Profit Factor 0.46 ($597,174,175) and the pit shell with the maximum NPV ($603,343,740) is 1%. However, the incremental strip ratio between the two pit shells is 8.9. Strip ratios represent the amount of waste material that must be removed in order to extract a given amount of ore. With that in mind, strip ratios are an indicator of risk, the general conversion being that the lower the strip ratio, the lower the mining cost which translates to higher profit margins. Conversely, higher strip ratios translate to high mining costs, and this is assumed to have the potential to kill the profitability of the deposit. The mathematical surface for the selected pit shell is shown on Figure 4:
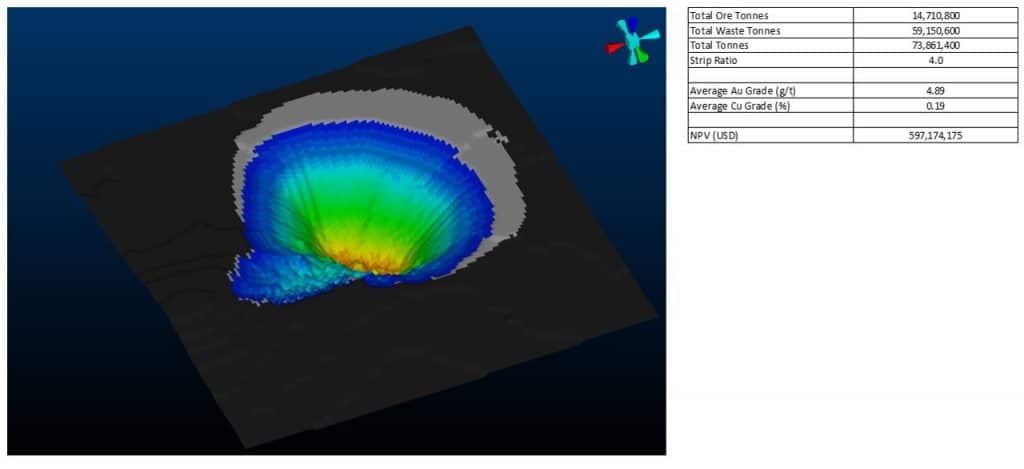
So, when looking for a shell that has an element of maximises NPV but also minimising risk, the Revenue Factor 0.46 shell is a good shell to consider. This shell doesn’t destroy much of the NPV (only 1%) but has a relatively lower strip ratio. The fact that the NPV curve remains relatively flat beyond Profit Factor 0.46 pit shell is an indication that the deposit is sensitive to prices. With such a deposit, the increase in strip ratio increases project risk. This is obviously a simplified approach to the selection of the ultimate pit shell – it focuses mainly on the technical aspects of mining and does not include considerations for aspects such as social licensing, financing the project etc.
Most of the time, organisations target the pit outline with the highest NPV when running the LOMP. However, NPV is not the only way to evaluate mining projects. Sometimes the optimal pit for a specific scenario may be the one that maximises some of your corporate goals. It is important to keep that in mind as your go through the pit optimisation process and selection of the ultimate pit shell.
At this stage of the process, one may want to run sensitivity analysis based on the economic and engineering parameters. You may want to see how the project is sensitive to price and cost changes, processing recoveries, slope region changes etc. Once you have selected the ultimate pit that is in line with your corporate objectives, the next step in the process involves converting the mathematical pit shell into a detailed pit design that can be mined safely and economically.
3. Detailed Pit Design
After running the pit optimisation and you have selected the pit shell that speaks to your corporate objective(s), you will have to design a detailed, operative pit design. The aim is to produce a design that deviates as little as possible from the selected mathematical shell outline. The detailed design has to ensure that the mine will be operating efficiently, operating fully within the mining rights and away from exclusion zones, minimises the haulage distances, maximises ore recovery, support production targets and it is compliant with the geotechnical and safety restrictions. With so many things to consider, you can tell from a distance that the design process is an iterative process that involves trading off the important design aspect mentioned above.
There are many different aspects that the design engineer has to keep in mind to ensure that the operative design is not only efficient, but it can also be exploited safely. This is a significant topic that I will cover in detail on a difference article, I mean I have already said a lot here haha. In summary, some of the key factors include pit access considerations, minimum mining width, ramp design parameters (ramp width, gradient, max road curvature, number of ramps and switchbacks etc.) as well as other geometrical slope considerations (such as the bench height and bench interval, bench face angle, berm width etc.) and safety features (flat areas on switchbacks, over-run straights, safety ramp run-offs).
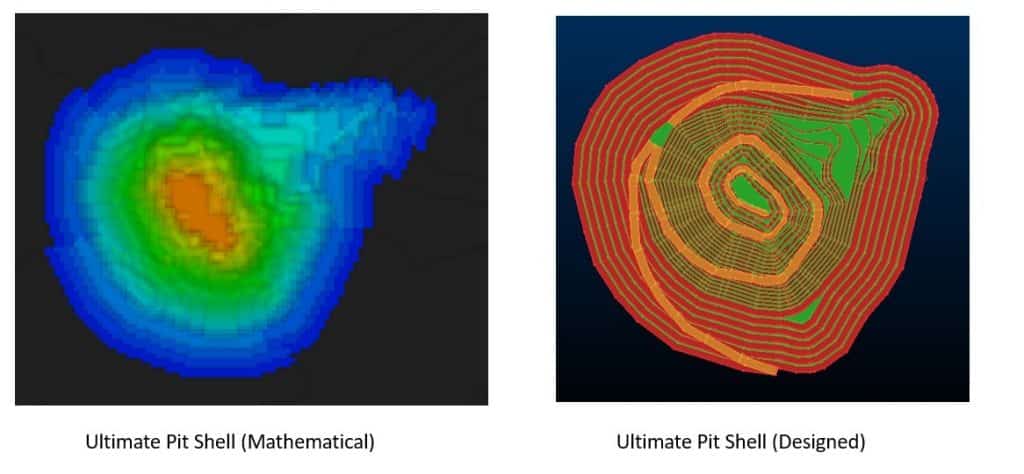
The optimised pit shell can be exported from Datamine’s Studio NPVS as a surface or as pit-limited blocks as can be used as a design guide on Datamine’s Studio OP. This is one of the biggest benefit of using the two systems together, the information from Studio NPVS can be easily consumed by Studio OP. Spatially, the selected ultimate pit shell and designed pit shell are shown on Figure 5.
One of the common ways of checking the quality of the produced designs is to measure the difference in tonnages and value between the selected mathematical shell and the operative design. Such a comparison is detailed in Table 3.
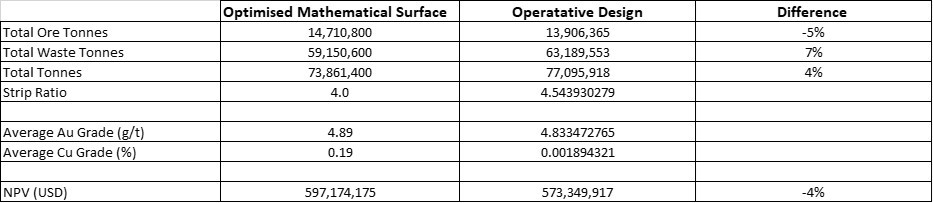
There is usually inherent loss of value between the optimised surface and the operative design due to the inclusion of ramps and berms. Addition of ramps and berms could either result in mining additional waste and/or leaving ore on the ground. The acceptable difference between the selected ultimate pit shell and the operative design varies from one operation to another. Depending upon the difference between the pit optimisation shell and the final operative design, it may be necessary to re-iterate through the pit optimisation stage using the new overall slope angle parameters from the just completed design.
Pit designing is both engineering and art, and it relies heavily on the judgement of the engineer. Traditionally, pit designing used to be a manual process that is slow, time consuming and expensive. Due to the process consuming time, it was very difficult to consider different design scenarios to check the robustness and profitability of the solutions. However, what if we told you that you do not have to compromise anymore because you can have a tool in your hands that will allow you to rapidly generate alternate practical pit designs, so that you can run the options that you want to test and still meet that deadline. Yes, Datamine\’s industry-leading auto-pit design tool is the answer to your miseries.
Once the operative design is complete, the next step involves importing the actual design back into Studio NPVS in order to continue with the pushback optimisation. This will definitely be covered in Part 2 of the article. Check this space!

Written by:
Thabang Maepa
Solution Lead – Open Pit Planning
Datamine Africa
Contact us for more information.